The closer... the unsafer: may the lack of safe distance be a silent contributor to the burden of traffic crashes in Spain?
Cuanto más cerca ... más inseguro: ¿puede la falta de distancia segura contribuir silenciosamente a la carga de los accidentes de tráfico en España?
Artículos Originales
Recibido: 30/01/2020
Aprobado: 25/02/2020
Publicado: 18/05/2020
Autores
Francisco Afonso
Mireia Faus
Sergio A. Useche
ABSTRACT
Not keeping an adequate safe distance is one of the elements that are directly related to traffic accidents. The main objective of this research was to identify the aspects that modulate the safe distance-accidents relation. Specifically, the frequency and reasons why drivers do not keep the safe distance, the perception of drivers regarding the probability of penalty, the penalties imposed and their severity, and the drivers’ opinion on the effectiveness of such penalties in changing this behavior. A questionnaire was administrated to a sample of 1,100 Spanish drivers having any kind of driving license. The results showed that only the 5,6% of drivers always or sometimes do not keep the safe distance. Among the specific reasons, the traffic conditions and congestions and drivers not realizing they were not keeping a safe distance were the most frequent ones. Likewise, drivers perceived that the probability of being caught (sanctioned) as a consequence of this misbehavior is considerably limited. Moreover, there were no respondents who had received a fine for not keeping a safe distance while driving. The results contrast with previous studies in which it is showed that not keeping a safe distance is a quite frequent behavior, and remark that several efforts are needed for strengthening the awareness of people on this matter, with the aim of reducing its related traffic crashes and their high multidimensional burden for societies
RESUMEN
No mantener la distancia de seguridad adecuada es uno de los elementos vinculados directamente con los accidentes de tráfico. El objetivo del presente manuscrito es conocer las tendencias de comportamiento de la población española con respecto a este factor de riesgo. Específicamente, la frecuencia y las razones por las cuales los conductores no mantienen la distancia de seguridad, la percepción de los conductores con respecto a la probabilidad de sanción, su severidad, así como la opinión de los conductores sobre la efectividad de dicha penalización para cambiar este comportamiento. Se administró un cuestionario a una muestra de 1.100 conductores españoles mayores de 14 años con licencia de conducir. Los resultados mostraron que solo el 5,6% de los conductores siempre o a veces no mantienen la distancia de seguridad. Entre las razones destaca no darse cuenta de no estar manteniendo la distancia de seguridad adecuada. En general, los conductores creen que el riesgo de accidente asociado a llevar a cabo esta conducta es alto, por lo que la gran mayoría afirma no infringir esta norma. Los resultados contrastan con estudios previos en los que se pone de manifiesto que no mantener la distancia de seguridad es una acción bastante frecuente, lo que se puede explicar, en parte, porque muchos conductores la realizan sin ser conscientes. En este sentido, se han de realizar esfuerzos para que la aparente concienciación de la población se refleje en el comportamiento de los conductores en la carretera
Introduction
Traffic accidents are a major cause of death and injury in the world and represent a high burden for the population in the economic, health and social fields. According to the World Health Organization, 1.23 million people worldwide die each year because of a traffic crash (World Health Organization, 2015; Salamati, et al., 2015). Note that, despite the increase of population and vehicles, the number of crashes has been stable since 2007, thus indicating an improvement in road safety practice in recent years. It is especially concerning that traffic crashes are the leading cause of death for people between 15 and 29 years old (World Health Organization, 2015; Patton, et al, 2009; Singh, Sighal, Lakhtaki y Rajpoot, 2016). If we focus on Spain, in 2011 there was a rate of 45 deaths per million inhabitants, a figure that places us below the average of the European Union. Also, since 2008, traffic crashes have gone from being the first external cause of death to being the second (Gómez, Lopez, Llácer, Palmera y Fernandez, 2015). Thus, there are lower and lower rates of casualties due to road crashes in the number of deceased and injured victims. This happens in part thanks to public awareness, and partly thanks to the measures implemented by the state administration (Brubacher, et al., 2014). But, despite all this, traffic crashes (“accidents” that the accumulated evidence suggest not to be that accidental) are still a serious problem for societies worldwide (Hamad, 2016).
In this sense, the question of why people are willing to comply with the law and to cooperate with the police has received more attention during the past several years (Bates, Antrobus, Bennet y Martin, 2015). According to the procedural justice model, this is caused by the fact that when civilians trust the police to treat them honestly and fairly, they will perceive the police as a legitimate institution that deserves respect and obedience (Van Damme y Pauwels, 2016). This is important because traffic safety policies are still conventionally based on financial and environmental criteria in developing countries, yet the concept of equity can be advantageously used as an integral part of the process of traffic safety policy making (Najaf, Taghi, Lavasani y Thill, 2016). Equity in transportation is defined as how appropriately and equally the impacts of transportation are distributed among different types of users (Lee, Sener y Jones, 2016).
Hence, within the risk factors and main causes of traffic crashes, we find human factors to be involved in up to 80-90% of them (Dingus, et al., 2016; Glendon, Clarcke y McKenna, 2016). People, due to various reasons such as fatigue, distraction, experience or alcohol intake, can make conscious or unconscious mistakes when driving, and these can be fatal if they cause a traffic accident (Zhang, Yau, Zhang y Li, 2016).The study presented in this manuscript focuses on safe distance in driving, and it represents a part of a broader research in which a set of risky behaviors normally performed by drivers were analyzed (Alonso et al., 2005b).
Safe distance is an important factor in traffic. Researches carried out by the DGT (General Directorate of Traffic of Spain) clarify the consequences of not keeping an adequate safe distance. For instance, a vehicle driving at 100km/h should keep a distance of at least 70 meters from the vehicle in front of it. This is a distance that would allow for enough braking space, without colliding with the other vehicle. If the distance were 50 meters, the collision would happen at a 64km/h speed, thus causing various levels of injury. If we reduce the distance to 30 meters, the collision will happen at 80km/h, causing the death of those who are in the vehicle (López, 2009). This implies a huge problem, since it has been demonstrated that not keeping a safe distance could be the second most frequent infraction in traffic accidents. Specifically, it appears in 85% of rear-end and multi-car collisions, both in urban environments and in highways and motorways, which leads to even more severe consequences (De Dios, 2013).
Not keeping a safe distance is often associated with drivers being over-confident, aggressive and stressed when at the wheel (Carbonell, Bañuls y Miguel, 1995). These factors make them exceed the speed limits and get too close to the vehicle in front of them. In fact, 19.6% of people who were driving at an excessive speed when they suffered an accident were not keeping a safe distance (De Dios, 2013).
Law, and all its related aspects, have an essential part that comes from legal science. Moreover, law applies to individuals and societies, so it has a lot to do with sociology and psychology. Individuals and societies may or may not know the laws, they may or may not accept them, they may or may not share their principles, and they may or may not obey them. In order for laws to be applied and obeyed, different sciences must be involved when developing them. In addition, law is not the only thing to take into account; rules make no sense unless there are consequences when they are not obeyed. From this approach, traffic laws must be treated from a comprehensive perspective. Moreover, it is important to understand legislation and everything it involves, and to regulate the drivers’ behavior, since reckless behavior not only affects the drivers themselves, but also other people (other drivers and pedestrians on the road). Therefore, understanding the legislation is preserving one’s own life and the life of others. So, this is why the framework of this article was a large scale project based on “traffic laws and road safety”, aimed at raising people’s awareness on this matter (Alonso, Esteban, Calatayud, Medina y Alamar, 2005a; Alonso, et al., 2005b). This global research on traffic laws and road safety used a questionnaire to analyze multiple behaviors that occur in the field of road safety. Specifically, it focused on driving at an excessive speed, not complying with the existent speed limits, not maintaining a safe distance, shouting or verbally insulting while driving, driving after drinking any alcoholic beverage , driving without seat belts, smoking while driving, driving without insurance and driving without having passed the ITV (mandatory technical inspection for vehicles). However, to be more specific, in this article we will examine the topic of safe distance as a highly mentioned issue in accident-causation reports.
Thus, to sum up, the aim of this study was to analyze the behavioral tendencies of the Spanish population that occur in the field of traffic and road safety. Particularly in this article, the behavior of not keeping the safe distance will be examined, specifically and in depth. Information will be provided on the frequency of this behavior in the population, the main reasons why such behavior is carried out or not, the severity with which drivers would sanction the behavior and the perceived probability of punishment in case of not keeping a safe distance, among other aspects..
Materials and Methods
Participants
The sample was obtained from a simple random sampling (SRS) based on gender, age, habitat and region. The criteria for the distribution of the sample are: The election of households in samples, proportional to the universe by Autonomous Community and habitat. For the election of individuals:
they should be proportional to the studied population, by age and sex. The survey was aimed at drivers with a driving license. The proportion of subjects is a reflection of the census, and it includes drivers from 14 to over 65 years old. In terms of age (see Table 1), it can be clearly seen how the percentage distribution is proportional to the general census of drivers. So, the most represented age group is the group between 30 and 44 years old (38.01%), while people between 14 and 17 years are the least represented.
The sample size was n= 1,100 (fully completed surveys), and it consisted of 678 men (61.60%) and 422 women (38.40%), operating with a margin of error for the general information of ± 3 with a confidence interval of 95% in the most unfavorable case of p=q=50%, and a level of significance of 0.05. The gender distribution is closely related to age: the older the sample, the more the proportion of women decreases. From age 45 and up, the percentage of women is reduced, as it happens in the driving population.
Table 1. Distribution of the number of drivers and sample based on age
| Age | Census | Distribution | Sample |
| 248.62 | 1.21 | 13 | |
| 18-24 | 1.987.05 | 9.67 | 106 |
| 25-29 | 2.635.76 | 12.83 | 141 |
| 30-44 | 7.809.78 | 38.01 | 418 |
| 45-65 | 6.158.15 | 29.97 | 331 |
| >65 | 1.706.37 | 8.31 | 91 |
| Total | 20.545.73 | 100 | 1.100 |
Procedure and design
The methodology used in this study was an observational cross-sectional method, in which people were questioned about their views on the appropriate and inappropriate safe distance; with “safe distance”, we understand the minimum distance that two vehicles must keep when driving at the same speed, in order to avoid crashes.
The questionnaire included questions about the knowledge, attitudes and behaviors of users regarding traffic and road safety. Its questions refer to both the assessment of current traffic rules and the assessment of behaviors on the road. The survey consists of a series of questions structured around a few different sections which address the objectives pursued in the investigation. It was applied through a semi-structured telephone interview by staff from EMER-GfK. The staff responsible for conducting the survey followed the instructions of the research team. The average duration of the interview was 20 minutes, with some variability due to individual differences.
To achieve our objectives, the following variables were taken into account:
- Demographic variables: sociodemographic factors, such as age and education level.
- Driving behavior: the drivers were asked about their opinions on the behavior “not keeping a safe distance” on the road. Moreover, this study also refers to the following behaviors: “excessive speed”, “driving after drinking”, “driving without insurance” and “driving without a seat belt, in the rear seats and in the city”,” shouting or verbally insulting while driving” and, “smoking while driving “.
- Information on driving behavior: information was extracted from these variables: behavior frequency, reasons for keeping or not a safe distance, perception of the accident risk, strength of sanction, punishable behaviors and modification of behaviors.
The interview covers various issues used to understand the behavior of users when considering safe distance. Before beginning to answer the questionnaire, participants received instructions on what is considered an adequate safe distance.
Participants were initially asked about the frequency of their driving without keeping a safe distance, to answer according to a Likert scale with the following possible responses: almost always, often, sometimes, rarely and never. Thus, according to their response, participants were asked for the reasons why they kept or not the safe distance while driving. Second, they were asked to assess the risk of causing an accident because of the lack of a safe distance, assessed from 0 to 10, with 0 being the minimum and 10 the maximum. Third, they were asked to value, again choosing between 0 and 10, which degree of severity would be adequate for sanctioning a person who drives without keeping a safe distance.
The fourth question asked whether driving without keeping the safe distance is legally punishable, with the response options “Yes”, “No” and “Do not know”. If the answer is yes, the participant was asked to answer how many times he/she was sanctioned for not keeping a safe distance, out of a total of 10 occurrences. The fifth question concerns whether the sanctions provided for driving without keeping the safe distance are a fine, incarceration, or temporary or permanent suspension of license. It was possible to answer “yes” or “no” to each one of the options.
The sixth question asked whether the respondent had received a penalty for driving without keeping the safe distance. Also, participants were asked to assess the severity of penalties, choosing among the following options: excessive, adequate, and poor. Finally, if the participant had received a penalty, the questionnaire asked whether he/she modified his/her behavior as a consequence.
Once the data was obtained, the relevant statistical analyses were carried out with the Statistical Package for Social Sciences (SPSS). For the comparison of mean values the unifactorial ANOVA test for repeated measures of the General Linear Model (GLM) procedure was used, followed by Bonferroni’s post-hoc test. Statistical significance was set at p - 0.05.
Results
Firstly, and as it is shown in Figure 1, the vast majority of respondents keeps the safe distance when driving. Thus, 76% of them never or almost never break this rule. Also, only 5.6% of them regularly drive without maintaining the safe distance (almost always and many times). This result is very positive, since the respondents answered the questionnaire after being given information on what an adequate safe distance is: therefore, the data are not biased by a poor understanding of the concept
Figure 1. Percentage distribution of the frequency by which participants do not keep a safe distance from other vehicles

Regarding why drivers perform this behavior, 31.4% do so because they do it unconsciously, while 16.7% said that traffic conditions and congestion are the cause. In this case, being in a hurry appears to be one of the most important reasons, with 11.4% of participants agreeing on this point. On the other hand, 6.4% say they do it intentionally. Only 1.9% claimed that they did not know the rule as a reason, as we see in Figure 2
Figure 2. Self-reported reasons for not keeping the safe distance while driving

As for the self-reported reasons by which respondents choose to maintain (or not) a safe distance while driving, there is a reason that stands out above the rest with a relevance of about 70%: “the probability of having an accident.” So, 19, 2% of participants keep a safe distance to prevent a possible sudden braking (Figure 3). It is positive that the main reasons for keeping a safe distance are related to safe driving, and not only to the possibility of being sanctioned (0.2% the possibility of economic sanctions and 0.2% the possibility of a license withdrawal).
Figure 3. Self-reported reasons for keeping the safe distance while driving

Regarding risk perception, not keeping the safe distance is placed in the 4th place, according to the opinion of respondents (M= 7.9; SD=1.672) (Figure 4). Therefore, it is a behavior assessed as highly risky. It must be said that 65% of drivers give it a score of 8, thus reflecting the broad conformity between respondents on the importance of maintaining the safe distance
Figure 4. Perceived crash (accident)s risk

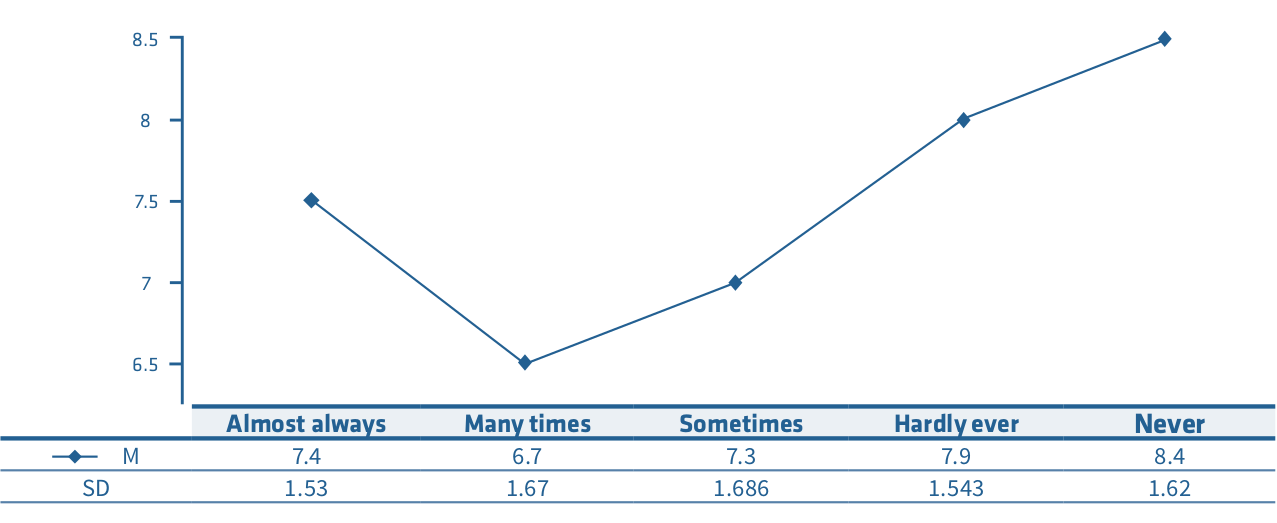
The age and gender of respondents were a factor that we had to assess, since significant differences were found in both cases. Regarding age (F (5, 1104) =2.693; p- 0.05), groups of 25 to 29 (M=8.1; SD=1.484) year-olds and 30 to 44 (M=8.1; SD=1.561) year-olds were the ones who thought that this behavior represents an increased risk, compared to other age groups. Meanwhile, young people are the ones who perceived the lowest risk (Figure 5). On the other hand, for what concerns the gender of participants (F (1, 1106) =3.562; p- 0.05, women assess “not keeping a safe distance” as a more dangerous behavior (M=8.0; SD=1.617) than men (M=7.8; SD=1.703). Figure 5. Perceived crash (accident) risk if safe distance is not kept, according to age groups

On the other hand, people who said they always or almost always do not keep the safe distance (meaning that they keep performing the incorrect behavior) have a lower risk perception than those who never or almost never break this law (F (4,1104) =22.822; p- 0.05) (Figure 6), which is very concerning
Figure 6. Perceived risk of accident perceived according to the frequency of the respondent ́s own misbehavior
In relation to the degree of severity with which respondents would sanction the behavior of not keeping a safe distance, there is a high agreement on the fact that is the fifth most punishable behavior, with a score of 7 (SD=2.137)
Figure 7. Perceived punishability of different misbehaviors, including not maintaining a safe distance between vehicles

In this sense, depending on the gender of respondents (F (1,1095) =2.756: p- 0.05) women are the ones who give the highest scores to the punishability of the behavior (M=7.2; SD=2.160), in comparison with men (M=7.0; SD=2.120). The results are coherent with women being the ones who perceive “not keeping a safe distance” as more dangerous than men, as we have said before.
It is noteworthy that as the respondents ́ level of knowledge of the current legislation decreases (F (3,1095) =3.921; p- 0.05), they would apply less and less severity to the sanction of the behavior “not keeping the safe distance” (Figure 8).
Figure 8. Perceived hardness (severity) of the sanction for this misbehavior

Most respondents believe that not keeping a safe distance is a behavior that should be punishable. Thus, 75.3% agree with this statement, while 24.7% disagree.
It is also noteworthy that the studied behavior only gets a 2.0 out of 10 (SD=2.204) in the risk assessment of perceived penalty. Thus, is the third behavior with lowest risk of punishment perceived (Figure 9).
Figure 9. Perceived risk of being sanctioned if different driving misbehaviors (including not keeping a safe distance) are performed

In relation to gender, there are significant differences (F (1,797) =11.500; p- 0.05), where women perceive more risk of being sanctioned for this behavior (M=2.3; SD=2.306) than men (M=1.8; SD=2.117).
If we focus on the type of sanction that drivers associated with not keeping the safe distance, 88% of them think it implies financial penalty, 11.5% believe that it leads to incarceration, and 53.5% think that it can be punished with the temporary or permanent suspension of the driver license (Figure 10).
Figure 10. Response trends according to the possible type of sanction

Discussion
Safe distance is a risk factor that seems to be considered by a big part of the population, since 75% of respondents claim that they always keep it, at least most of the time. Also, only just over a 5% say they never keep the safe distance This is a figure that contrasts with previous studies on the causes of accidents, where not keeping a safe distance happens in one fourth of rear-end and multi-car collisions (De Dios, 2013). It also contrasts with a study that found how the introduction of the license with points did not reflect a significant reduction in the penalties for not keeping the safe distance (Montoro, Roca y Tortosa, 2008). This could be enhanced by the low perceived (and objective) punishability and surveillance over this road misbehavior. In fact, in our study there was no percentage of respondents who had been sanctioned because of it. Therefore, the decrease in the number of this type of offense in Spain was not as high as in the case of other most common and frequent unlawful behaviors (Marti-Belda et al., 2019). This discrepancy in the study can also be due to social desirability bias, in which participants provide the answer they know to be “correct” ” (Enriquez y Dominguez, 2010), or else to drivers not being aware of not keeping a safe distance, which would be seriously concerning and dangerous. This last point is coherent with the main reason provided by participants when asked why they did not respect the safe distance: they do not realize they are doing it. The fact that drivers can lack awareness when they are not keeping a safe distance could be related to driving stress and aggressiveness. Some people have a tendency to drive when they find themselves in a potentially nervous or tense mental state, and this may eventually show up in their driving performance as risky behaviors (Useche, Gómez y Cendales, 2017; Alonso et al., 2002). In addition to showing irritation towards oneself, other users, or even elements of the road, these people tend to accelerate, which leads to excessive speed and lack of safe distance (Fernández y Mielgo, 1992). Different studies have found that traffic conditions may produce stress in drivers (Useche, Cendales, Montoro y Esteban, 2018). Thus, coupled with personal and social factors that can also cause stress, the driver of the vehicle is subjected to a consistent pressure that may involve cognitive, physiological and behavioral responses (Carbonell, et al., 1995). On the other hand, we must say that the behavior of not keeping the safe distance is perceived to have a fairly high risk, compared with other unlawful behavior, since it has an average score of 7.9/10. This is consistent with how, for instance, participants attributed a value of 7 to the degree of severity with which this behavior should be punished. However, most of them think that the risk of being caught when breaking this rule is low. This can be related to the low numbers of real sanctions applied to this behavior, which leads the population perceiving the possibility of being sanctioned for not keeping the safe distance as extremely low. This is interesting, since it implies that the low rates of performance of this behavior are more related to users thinking of their own safety, rather than of the risk of being sanctioned. This can be seen in the reasons given for keeping a safe distance, among which “the possibility of suffering an accident” stands out
Limitations of the study
The main limitation of this study is related to the response bias that may exist in the completion of the questionnaire. It must be highlighted that respondents were reminded at all times that their answers were anonymous, and that sincere answers are of great importance. However, one of the disadvantages of this data gathering technique is the possible lack of sincerity, as well as possible differences in the understanding and/or interpretation of some questions. Despite these little disadvantages, phone interviews were chosen because they allow for a much more representative sample for the Spanish population, in comparison with what could have been obtained using other methods
Conclusions
The results of this study show a high level of self-reported awareness among Spanish drivers in what concerns the risk of not keeping a safe distance while driving. However, in practical settings, a considerably high percentage of them do not have the habit of keeping a safe inter-vehicle distance, principally due to factors such as the unawareness of their own driving behavior, the high crowding of urban areas and individual/circumstantial factors such as being in a hurry. Furthermore, it is interesting that a certain proportion of drivers deliberately commits this misbehavior based on the perception that everybody else performs it while driving as well. It would be interesting for future research to study the differences in the perception of safe distance depending on the type of vehicle that the user usually employs.
It is necessary to keep making efforts in order to turn this awareness into real effects on the road. In this sense, the findings of this study suggest that more emphasis on informative, normative and punitive issues might contribute to increase the risk perceived in driving without keeping a safe distance. A higher risk perception may explain a lower exposure to risk, potentially translated in less traffic accidents and a lower burden to (e.g.) insurance companies and healthcare systems.
On the other hand, road trainings provided by driving schools and other specialized entities are encouraged to focus more on this matter, as a manner of strengthening the safe road behaviors of drivers. This action would be very advantageous when training specific risk groups, such as young/ new drivers and other road users (Oviedo-Trespalacios y Scott-Parker, 2017). It could provide more emphasis on the least considered aspects of road safety. Also, and considering the importance of information flows for road safety, mass-media could help putting the focus on both this particular issue and other latent threats to driving safety.
Acknowledgments
The authors wish to thank all participants of the study, as well as the stakeholders who provided support and technical advice to the research. Also, special thanks to Runa Falzolgher for the professional editing of the final version of the manuscript.
References
- Alonso, F., Esteban, C., Calatayud, C., Medina, J. E. and Alamar, B. (2005a). La Justicia en el Tráfico. Análisis del ciclo legislativo-ejecutivo a nivel internacional. Cuadernos de Reflexión Attitudes, Attitudes, Barcelona.
- Alonso, F., Sanmartín, J., Calatayud, C., Esteban, C., Alamar, B. and Ballestar, M. L. (2005b). La justicia en el Tráfico. Conocimiento y valoración de la población española. Cuadernos de Reflexión Attitudes, Attitudes, Barcelona.
- Alonso, F., Sanmartín, J., Calatayud C., Esteban, C., Montoro, L., Alamar, B., Toledo, F., Chofre, E., Lijarcio, I., Chisvert, M. & Carrascosa, V. (2002). La agresividad en la conducción: Una investigación a partir de la visión de la población española. Cuadernos de Reflexión Attitudes, Attitudes, Barcelona.
- Bates, L. J., Antrobus, E., Bennett, S. & Martin, P. (2015). Comparing Police and Public Perceptions of a Routine Traffic Encounter. Police Quarterly, 18(4), 442-468. DOI: 10.1177/1098611115589290.
- Brubacher, J. R., Chan, H., Brasher, P., Erdelyi, S., Desapriya, E., Asbridge, M., Purssell, R., Macdonald, S., Schuurman, N. & Pike, I. (2014). Reduction in Fatalities, Ambulance Calls, and Hospital Admissions for Road Trauma After Implementation of New Traffic Laws. American Journal of Public Health, 104 (10), 89-97. DOI: 10.2105/AJPH.2014.302068
- Carbonell, e., Bañuls, R & Miguel-Tobal, J. J. (1995). El ambiente de tráfico como generador de ansiedad en el conductor: Invantario de situaciones ansiógenas en el tráfico (ISAT). Anuario de Psicología, 65,165-183.
- Dingus, T. A., GUO, F., Lee, S., Antin, J. F., Pérez, M., Buchanan-King, M. & Hankey, J. (2016). Driver crash risk factors and prevalencie evaluation using naturalistic driving data. PNAS, 113 (10), 2636-2641.
- Enriquez, F.J. & Domínguez, A.C. (2010). Social desirability responding influence in training report evaluations. Psicología Iberoamericana, 18(1), 69-79.
- Fernández Seara, J. L., & Mielgo Robles, M. (1992). Escalas de apreciación del estrés. EAE. Madrid TEA Ediciones, SA.
- Glendon, A. I., Clarke, S. G. & McKenna, E. F. (2016). Human Safety and Risk Management, Boca Ratón, United States: Taylor & Francis.
- Gómez-Barroso, D., López-Cuadrado, T., Llácer, A., Palmera Suárez, R. & Fernández-Cuenca, R. (2015). Análisis espacial de los accidentes de tráfico con víctimas en carretera en España, 2008-2011. Gac Sanit, 29 (S1), 24-29.
- Hamad, K. (2016). Road traffic accidents trends in Sharjah, United Arab Emirates during 2001-2014. International Journal of Vehicle Safety, 9(1), 24 DOI: 10.1504/IJVS.2016.077151
- Lee, R.J., Sener, I.N. & Jones, S.N. (2016). Understanding the role of equity in active transportation planning in the United States. Transport Reviews. DOI:10.1080/01441647.2016.1239660
- López, M. (2009). La vida, cuestión de metros. Tráfico y seguridad vial, 195, 20-21.
- Martí-Belda, A., Pastor, J.C., Montoro, L., Bosó, P., & Roca, J. (2019). Persistent Traffic Offenders: Alcohol Consumption and Personality as Predictors of Driving Disqualification. The European Journal of Psychology Applied to Legal Context, 11, 81-92. DOI: 10.5093/ejpalc2019a3
- Mohammad, S., Zuduo, Z., Mazharul. H. M. & Simon, W. (2015). Revisiting the Task-Capability Interface model for incorporating human factors into a car-following models. Transportation Research Part B, 82, 1-19.
- Montoro, L., Roca, J. & Tortosa, F. (2008). Influencia del permiso de conducción por puntos en el comportamiento al volante: percepción de los conductores. Psicothema, 20 (4), 652-658.
- Najaf, P., Taghi Isaai, M., Lavasani, M. & Thil, J.C. (2016). Evaluating traffic safety policies for developing countries based on equity considerations. Journal of Transportation Safety & Security, 9, 178-203. DOI: 10.1080/19439962.2016.1230163
- Oviedo-Trespalacios, O., & Scott-Parker, B. (2017). Young drivers and their cars: Safe and sound or the perfect storm? Accident Analysis & Prevention, 110, 18-28. DOI: 10.1016/j.aap.2017.09.008
- Patton, G. C., Coffey, C., Sawyer, S. M., Viner, R., Haller, D. M., Vos, T., Ferguson, J. & Mathers, C. D. (2009). Global patterns of mortality in young people: a systematic analusis of population health data. The Lancet, 374, 881-892.
- Salamati, P., Moradi, A., Soori, H., Amiri, M. & Soltani, M. (2015). High crash áreas resulting in injuries and death in Tehran traffic areas from november 2011 throught february 2012: a geographic information system analysis. Medical Journal of the Islamic Republic of Iran, 29, 214.
- Singh Yadav, S., Sighal, V., Lakhtakia, P. K. & Rajpoot, M. (2016). Study of road traffic accident cases reported in a tertiary care hospital in Vindhya region of M. P. with the use of WHO/CDC injury surveillance system. Journal of evidence based medicine and healthcare, 3 (8), 235-242.
- Useche, S.A., Cendales, B., Montoro, L., & Esteban, C. (2018). Work stress and health problems of professional drivers: a hazardous formula for their safety outcomes. PeerJ, 6, e6249. doi: 10.7717/peerj.6249
- Van Damme, A. & Pauwels, L. (2016). Why are young adults willing to cooperate with the police and comply with traffic laws) Examining the role of attitudes toward the police and law, perceived deterrence and personal morality. International Journal of Law, Crime and Justice, 46, 103-116.
- World Health Organization. (2015). Global Status Report on Road Safety. Switzerland.
- Zhang, G., Yau, K. K. W., Zhang, X. & Li, Y. (2016). Traffic accidents involving fatigue driving and their extent of casualties. Accident Analysis & Prevention, 87, 34-42. DOI:10.1016/j.aap.2015.10.033